Your continuous production review

Recover value from production data you already have.

FieldState reviews every brownfield well on a recurring cadence and turns production signals into an evidence-backed action backlog: monitor, fix data, validate, or approve intervention.

See the asset-level backlog first, then drill into the well-level evidence.

FieldState Monthly Asset Review
March 2026 · 126 wells reviewed · Brownfield production review
Review cycle complete
Reviewed
126 / 126 wells
Full asset coverage this cycle
Opportunity surfaced
$1.8M
18 wells · screening NPV
Value at risk
$540k
15 wells with unresolved issues
Deferred production
12.8k bbl
7 validation cases
All126
Execute if validated3
Validate hypothesis7
Data fix11
Monitor101
Economic limit review4
Ready for service handoff3 wells · $390k
Ranked candidate list
Sorted by decision value and evidence readiness
C-018
Execute if validated
Confirm service scope
$126k NPV
A-
A-104
Validate hypothesis
Check lift status
$74k NPV
B
B-221
Data fix
Rebuild production days
D

Example values shown for layout only. Production economics are calculated from operator-provided assumptions and evidence available in the review.

From your data to action

Your production data becomes a ranked action backlog.

Start with the data you already have. Each review turns new signals into decisions your team can act on.

01
Production data

Monthly oil, water and gas by well, producing days, uptime, downtime and field records already in your files.

02
Analysis

Rates are normalized, active days are checked, clean intervals are selected, and DCA segments are qualified before economics are calculated.

03
Events

Restarts, shut-ins, regime shifts, downtime, water-cut changes, GOR/WOR shifts and validation gaps are surfaced.

04
Actions

Monitor, data-fix, DCA review, status check, validation and intervention candidates are ranked in one backlog.

05
Value

You see Basic NPV, IRR, Economic Limit Date, deferred production, CO₂ intensity, cost of waiting and review-ready evidence.

Candidate detail

Drill into the candidate behind the row.

Each ranked row opens into a reviewable candidate card with economics, evidence, required validation and a clear next owner.

01

Your wells are reviewed

Production, downtime, lift context and field records are checked on a recurring cadence.

02

You receive the backlog

Every well is screened, explained and ranked with preliminary economics, evidence and required validation.

03

Your team chooses actions

Asset, operations, finance and engineering teams review the same monthly candidate list.

Candidate Decision Card

Well C-018

Execute if validated
Basic NPV
$126k
IRR
51%
Economic Limit Date
Sep 2028
Deferred Production
3,400 bbl
CO₂ Intensity
11.8 kg/bbl
Required Validation
Confirm service scope and field constraint
Evidence Grade
A-
Next Owner
Asset Manager
Stance
Execute if validated

Example values shown for layout only. Production economics are calculated from operator-provided assumptions and evidence available in the review.

Screening economics

Preliminary economics for production decisions.

FieldState economics are designed to rank, defer and validate production actions. They help your team decide which wells deserve attention now, which need field validation first, and which should not receive service spend yet.

These are screening-level economics for prioritizing, validating and deferring production actions. Final reserves, AFE and certified emissions workflows remain with your existing operator controls.

Basic NPV

Directional net present value using operator-provided price, cost, intervention and decline assumptions.

IRR

Simple return screen where forecast response and intervention cost make the calculation meaningful.

Economic Limit Date

Estimated date when the well falls below the economic cutoff under the selected assumptions.

Deferred Production

Simple cost-of-waiting estimate for delayed validation or delayed intervention.

Basic CO₂ Intensity

A kg/bbl screening metric for portfolio context, tie-breaks and marginal-well review.

Assumption Panel

Oil price, discount rate, lifting cost, water cost, fixed OPEX, intervention cost and CO₂ factors stay visible.

Evidence gates

Positive economics is not enough.

FieldState does not promote a well to action because one number looks good. Each candidate is gated by data quality, active-day logic, selected DCA intervals, fit confidence, status history and required field evidence.

Positive economics + strong evidence
Execute if validated
Positive economics + weak evidence
Validate hypothesis
Positive economics + bad data
Data fix / DCA review
Weak economics + strong evidence
Monitor / defer
Near economic limit + low recovery potential
Do not spend / economic limit review
Marginal economics + high CO₂ intensity
Require stronger justification
The report can say “do not spend yet.” That is part of the value.
Product scope

What FieldState is built to do.

FieldState is a recurring production decision review for brownfield operators. It turns existing production, uptime and field records into a ranked action backlog with preliminary economics, evidence gates and owner-ready next steps.

Review every well on cadence

Each well is screened repeatedly as new production, downtime, restart and validation evidence arrives.

Rank actions with screening economics

Basic NPV, IRR, Economic Limit Date, deferred production and CO₂ intensity help prioritize what deserves attention now.

Gate recommendations before spend

Data quality, active-day logic, selected DCA intervals, fit confidence and field evidence determine whether a case moves to action or validation.

Keep assumptions operator-owned

Oil price, discount rate, lifting cost, water cost, fixed OPEX, intervention cost and CO₂ factors stay visible beside the result.

Prepare the service-spend handoff

Validated candidates carry the reason, economics, required evidence, suggested next step and owner before field or service dollars are committed.

FieldState provides screening-level decision support. Final technical, financial and commercial approvals remain with the operator's existing controls.

Why stay covered

Your wells become actionable in windows. Ongoing review catches those windows.

At any single point in time, many wells have nothing defensible to improve. Your first report typically surfaces around 5% of wells as current candidates. Continuous review follows the lifecycle of each well, so your opportunity pool can reach up to 30% as new production, downtime, restarts and validation evidence arrive.

One-time review
~5%

of wells typically surface as current candidates

Your one-time report is useful, but it mostly catches wells that are already visible in the loaded history.

Continuous monitoring
up to 30%

of wells can enter the opportunity pool over time

As your new months, restarts, downtime, water-cut shifts and validation events arrive, more candidates become visible and defensible.

Opportunity pool means wells that become defensible candidates for monitoring, data fix, validation or intervention review over time. It does not mean 30% of wells become immediate workover candidates.

Start

Baseline

Your existing monthly oil, water and gas by well create the first economic and physics read.

Weekly

Signals

New production, downtime, restarts, water-cut shifts and validation gaps are watched as they appear.

Monthly

Action backlog

Your ranked candidate list is refreshed with economics, required evidence and owner-ready next steps.

Quarterly

Board pack

You get coverage, value captured, value at risk and the current portfolio stance.

Service spend handoff

From well review to service decision.

FieldState gives operations and procurement a defensible handoff before service dollars are committed: why this well, why now, what to validate and what is ready for approval.

Why this well

The production signal, status change, DCA segment and economic screen that put the well into the backlog.

Why now

Cost of waiting, deferred production, economic limit timing and urgency behind the recommendation.

What to validate

The field evidence required before a service request, workover scope or intervention decision is approved.

What not to buy yet

Candidates with weak data, weak economics or missing validation stay out of service spend until the case is defensible.

Start with existing files

What we need to start.

You do not need a new sensor program or a data lake to begin. Missing records lower the evidence grade and create validation tasks; they do not block the first review.

Required to begin

  • Well list
  • Monthly oil, water and gas by well
  • Producing days or active-day proxy
  • Basic well status, if available
  • Oil price and cost assumptions
  • Intervention cost assumptions or ranges

Useful when available

  • Uptime and downtime tags
  • Field notes and service tickets
  • Lift, choke and restart context
  • Water handling / disposal cost
  • Fixed OPEX by lease or asset
  • CO₂ factor or emissions proxy
  • Prior workover / intervention history
First output: data-quality map, reviewed wells, preliminary economics, ranked action backlog and required validation list.
Your report

A reviewed decision report for every well, every month.

Your report opens with the recommended stance, headline KPIs, uncertainty range and regime-shift timeline. The pages underneath show exactly why the recommendation was made.

monthly review / selected wellEvidence-ready
FieldState Well Review Report - Executive summary view
Your evidence

Concise at the top. Verifiable at the bottom.

Your leadership gets the conclusion first. Your engineers can drill into source data, formulas, segments and proxy assumptions before trusting the recommendation.

Top

Business conclusion

Recommended stance, value, urgency, owner and reason the prior read no longer applies.

Evidence

Source lineage

Production coverage, data-quality gates, selected intervals and excluded periods stay visible.

Math

Formulas and segments

DCA fits, economic inputs, segment choices, Basic NPV, IRR and confidence measures sit beside the result.

Assumptions

Proxy assumptions

Directional phase and rel-perm proxies are marked as proxies, not reservoir-model claims.

Drill-down

Calculation check

The technical pages let the operator trace the recommendation back to the underlying numbers.

Operating views

One review. Three operating views.

Leadership, engineering and operations review the same calculation chain at different levels of detail.

Leadership & Finance

Value at risk, Basic NPV, IRR, Economic Limit Date, payback and portfolio stance.

Engineering

Source data, active days, data-quality gates, selected intervals, excluded periods, DCA fits, formulas and proxy assumptions.

Operations

Validation queue, field checks, service-priority handoff, required evidence and next owner.

Calculation trace

See one well traced end-to-end.

Your engineer can follow the same case from raw production to final stance. The goal is not to hide the calculation. The goal is to make the decision reviewable.

  1. 01Raw monthly production and producing days
  2. 02Active-day normalization and rate calculation
  3. 03Data-quality flags, outliers and excluded periods
  4. 04Status timeline: flowing, shut-in, restart, partial month or flush
  5. 05Selected decline interval and DCA fit confidence
  6. 06Forecast range to economic cutoff
  7. 07Basic NPV, IRR, Economic Limit Date and deferred production
  8. 08Recommendation bucket, required validation and next owner
If the fit is weak, the report holds the case in validation instead of promoting it to action economics.
What your team can verify

Every page answers a decision question.

Your engineers can check the data quality, selected intervals, decline fits, uncertainty, economics and assumptions before approving field work.

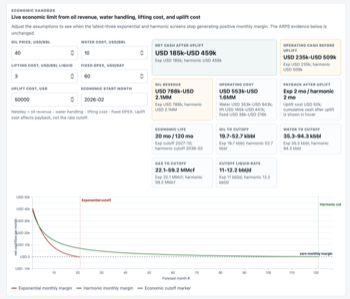
End-of-history screen
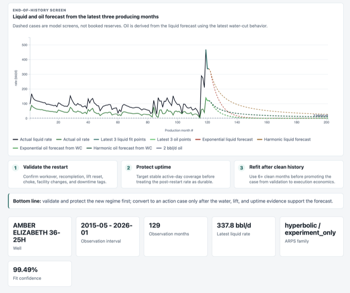
End-of-history forecast

Last-3 DCA forecast

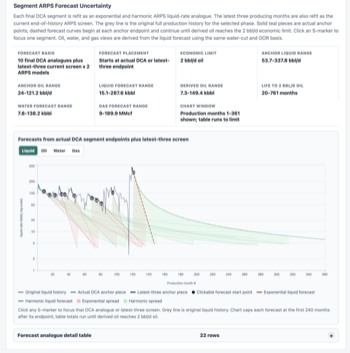
Fits exponential and harmonic screens to the latest three producing months and projects them to the economic cut-off. Includes well metadata, fit confidence, and the “validate then convert” guardrail (restart, uptime, refit) so a single hot month does not become an action case.

Economic sandboxEconomic sandbox

Economic assumptions and limit date

Operator-tunable inputs — oil price, discount rate, water cost, lifting cost, fixed OPEX, intervention cost and CO₂ factor — drive a live recompute of Basic NPV, IRR, Economic Limit Date, deferred production, payback and economic life. The DCA evidence does not move; the economics around it do.

MethodologyMethodology and data quality

Methodology & data quality

States the calculation path up front: normalize production, check active days, qualify clean decline windows, flag anomalies, fit DCA only on validated intervals, and treat economics as a screening read until field evidence supports action.

Production overviewProduction overview and fluid mix

Production & fluid mix

Normalizes oil, water and gas to comparable daily rates, then surfaces water-cut, WOR and GOR. The point is to separate real decline from a phase shift before drawing any conclusion.

DCA intervalsDCA interval selection

Decline interval selection

Filters restarts, shut-ins, partial months and one-month spikes so the DCA fit lands on a physically stable decline window. If the chosen interval contains an outlier, the report tells the engineer to rebuild the interval before trusting the fit.

DCA segmentsFinal DCA segments

Final DCA segments

Compares every clean segment in the well’s history — absolute and normalized — so engineers can see whether the current decline is structurally different from earlier producing periods.

Forecast uncertaintySegment DCA forecast uncertainty

Segment DCA uncertainty

Refits each clean segment as both exponential and harmonic. The fan of forecasts gives a defensible range for remaining oil, water and gas to the 2 bbl/d economic limit — not a single point estimate.

DCA fit basisDCA fit and forecast basis

DCA fit & confidence

Shows exponential, harmonic and hyperbolic fit options with the working confidence score and error metrics. If the fit does not explain history, the report holds the case in validation rather than promoting it to action economics.

Phase behaviorPhase behavior and relative permeability proxy

Phase / rel-perm proxy

A directional proxy — not a calibrated reservoir model — for whether water or gas is taking mobility and limiting oil flow. Used as a diagnostic pointer toward water-control vs. phase-interference hypotheses.

RecommendationRecommendation and decision summary

Executive recommendation

The report opens with the recommended stance, headline KPIs, uncertainty range and regime-shift context. Detailed pages underneath carry required field evidence, preliminary economics and a clear next-action owner.

Example screenshots on this page are intentionally rendered at low fidelity. The reports we prepare from your data are delivered in full detail.